The Environmental and Anomalous Phenomena Bias
Dimensions, Sensors, and Experimental Applications
Twenty-one dimensions of environmental, energetic, and potentially anomalous phenomena were organized into five categories, electrical/magnetic/electromagnetic, acoustics and vibration, optical/thermal/photonic, environmental and physico-chemical, and integration and control, each associated with a recommended sensor or piece of equipment and a concrete experimental application.
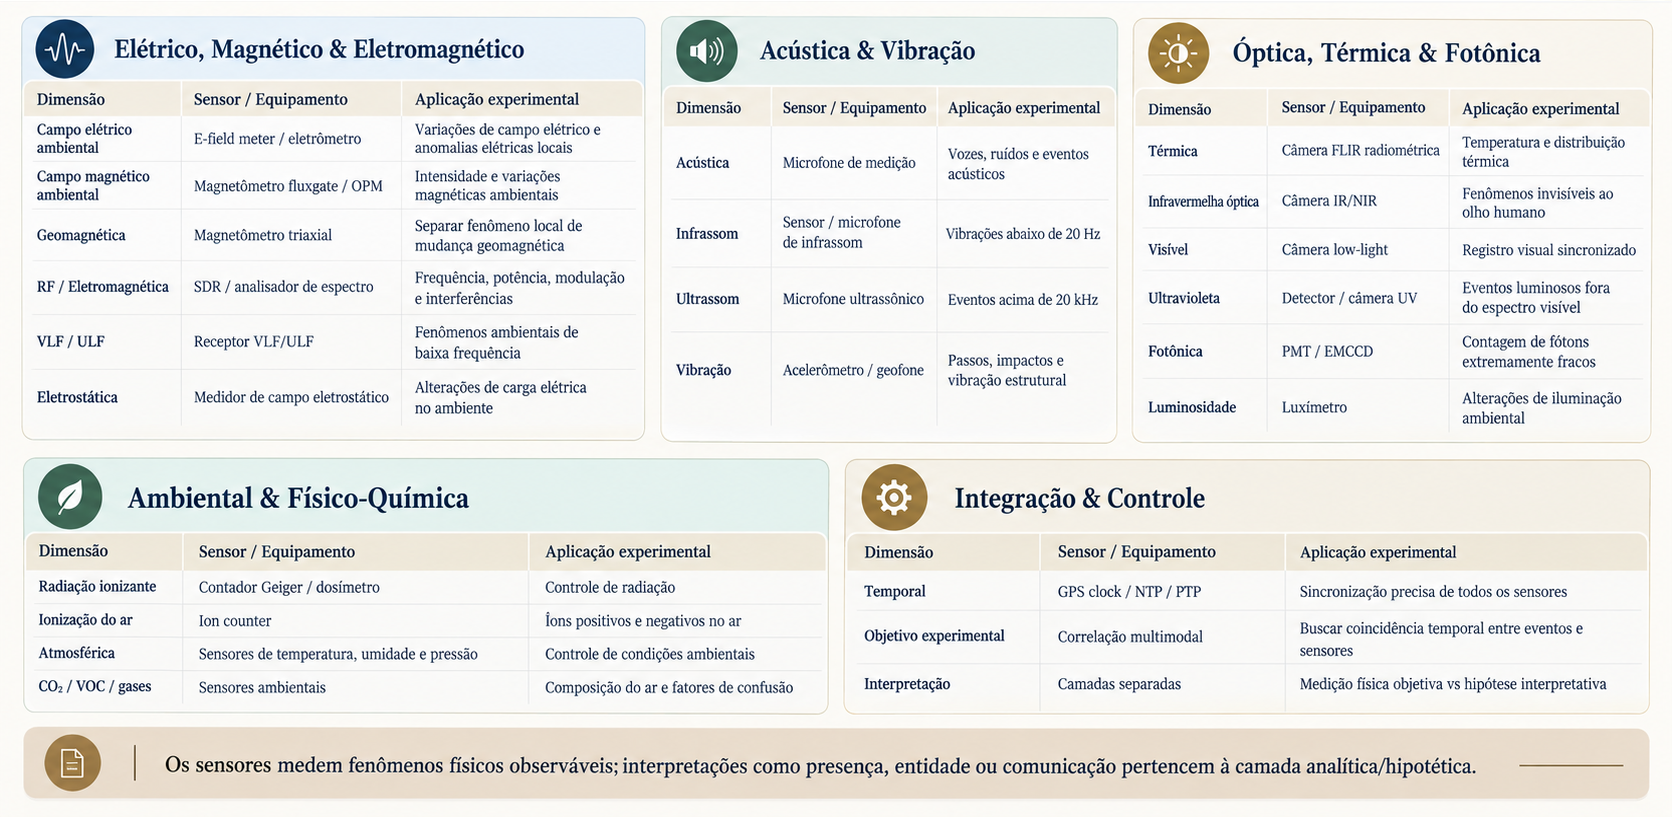
| # | Dimension | Equipment / Sensor (examples) | What it objectively measures | Experimental application |
|---|---|---|---|---|
| 1 | Ambient electric field | E-field meter / Electrometer | Electric field variations | Unusual electrical changes |
| 2 | Ambient magnetic field | Fluxgate magnetometer / OPM | Magnetic intensity and variations | Local magnetic anomalies |
| 3 | Geomagnetic | Triaxial magnetometer | Earth's field X/Y/Z | Separating a local phenomenon from global variation |
| 4 | RF / Electromagnetic | SDR / Spectrum analyzer | Frequency, power, modulation | Transmissions and interference |
| 5 | VLF / ULF | VLF/ULF receiver | Very low frequencies | Low-frequency phenomena |
| 6 | Acoustic (audible) | Measurement microphone | Audible sound | Voices, noises, and acoustic events |
| 7 | Infrasound | Infrasound microphone | Frequencies < 20 Hz | Inaudible vibrations |
| 8 | Ultrasound | Ultrasonic microphone | Frequencies > 20 kHz | Events outside human hearing |
| 9 | Vibration | Accelerometer / Geophone | Mechanical motion | Footsteps, impacts, structural vibration |
| 10 | Thermal | FLIR camera (A50/A70) | Temperature and thermal distribution | Unusual hot/cold regions |
| 11 | Infrared (optical) | IR/NIR camera | Infrared radiation | Phenomena invisible to the naked eye |
| 12 | Visible (low light) | Low-light camera | Light and motion | Synchronized visual recording |
| 13 | Ultraviolet | UV camera / detector | UV radiation | Luminous events outside the visible spectrum |
| 14 | Photonic | PMT / EMCCD | Photon counting (UPE) | Low-intensity luminous events |
| 15 | Ionizing radiation | Geiger counter / dosimeter | Alpha, beta, gamma | Monitoring radiation variations |
| 16 | Electrostatics | Electrostatic field meter | Electrostatic field/charge | Changes in ambient charge |
| 17 | Air ionization | Ion counter | Positive/negative ions | Environmental physico-chemical changes |
| 18 | Atmospheric | Temp./humidity/pressure station | Ambient conditions | Ruling out meteorological explanations |
| 19 | CO2 / VOC / gases | Environmental sensors | Air composition | Identifying environmental causes |
| 20 | Luminosity | Lux meter | Light intensity | Detecting lighting changes |
| 21 | Temporal | GPS Clock / NTP / PTP | Precise time | Synchronizing all sensors |
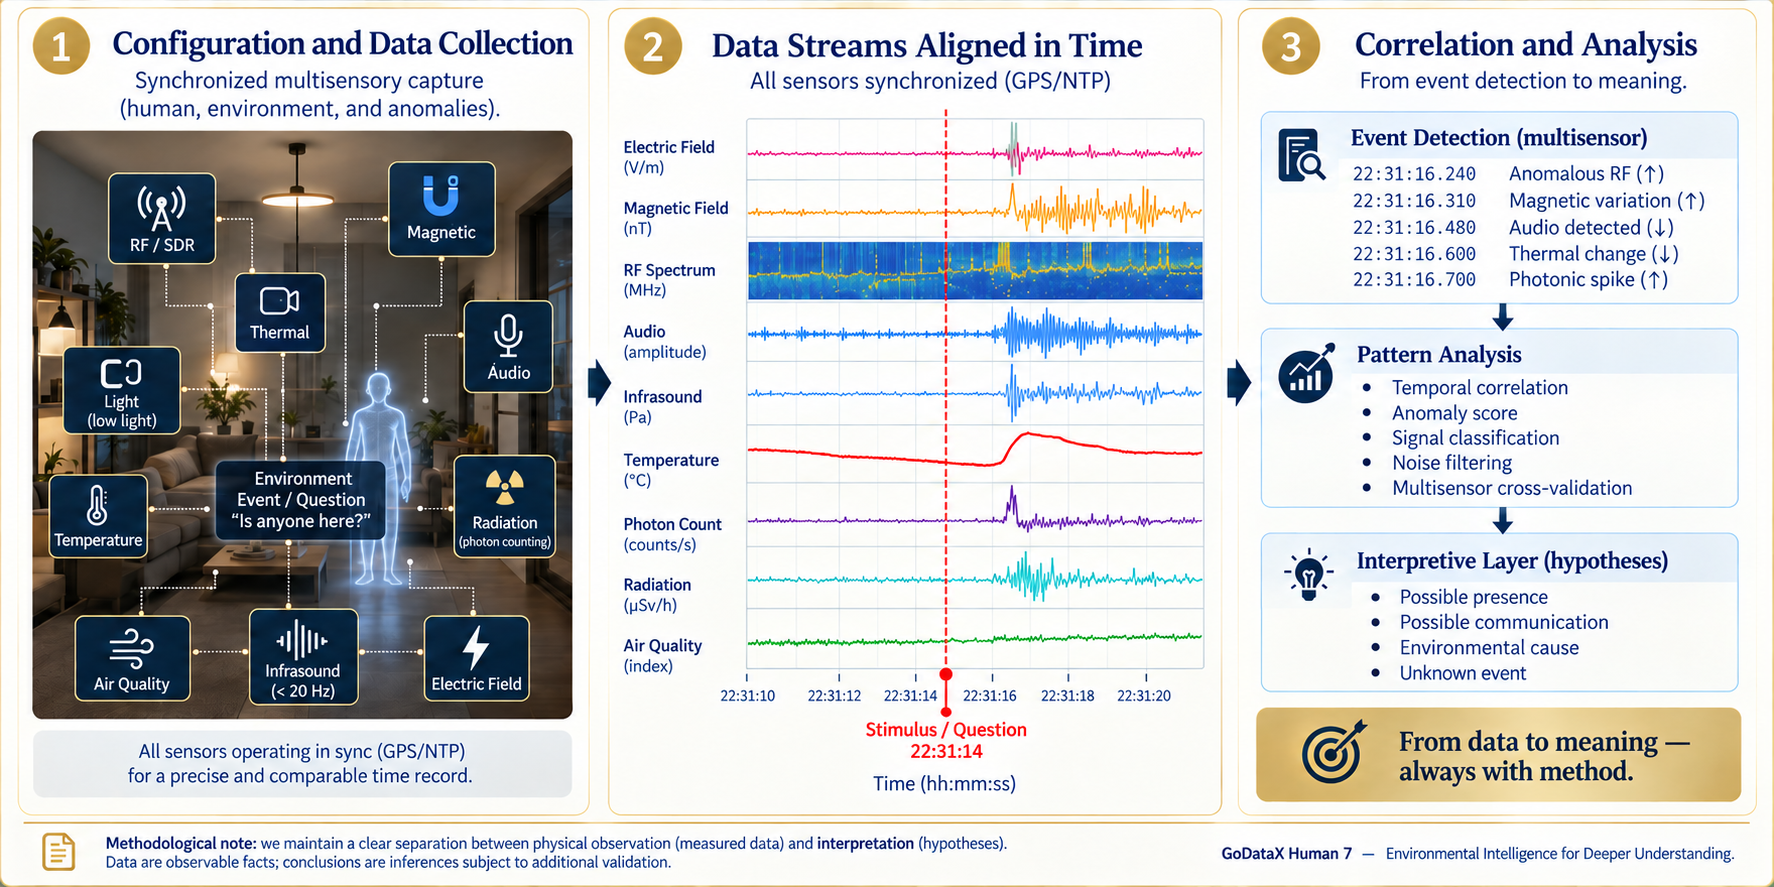
From Sensing to Insight, a detailed example of integrated analysis
An end-to-end example with multisensor synchronization, from collection to meaning, in three stages:
1Setup and Data Collection
Synchronized multisensor capture (human, environment, and anomalies): RF/SDR, magnetic, thermal, audio, light (low luminosity), temperature, air quality, infrasound (<20 Hz), electric field, and radiation (photon count), all around the environment/event/question “Is anyone here?”. All sensors run synchronized (GPS/NTP) for precise, comparable temporal recording.
2Time-Aligned Data Streams
All sensors synchronized (GPS/NTP): electric field (V/m), magnetic field (nT), RF spectrum (MHz), audio (amplitude), infrasound (Pa), temperature (°C), photon count (counts/s), radiation (µSv/h), and air quality (index), aligned against a time-stamped stimulus/question (e.g., 22:31:14).
3Correlation and Analysis
Event detection (multisensor): RF anomaly, magnetic variation, audio detected, thermal change, photon spike. Pattern analysis: temporal correlation, anomaly score, signal classification, noise filtering, cross-sensor validation. Interpretive layer (hypotheses): possible presence, possible communication, environmental cause, unknown event.
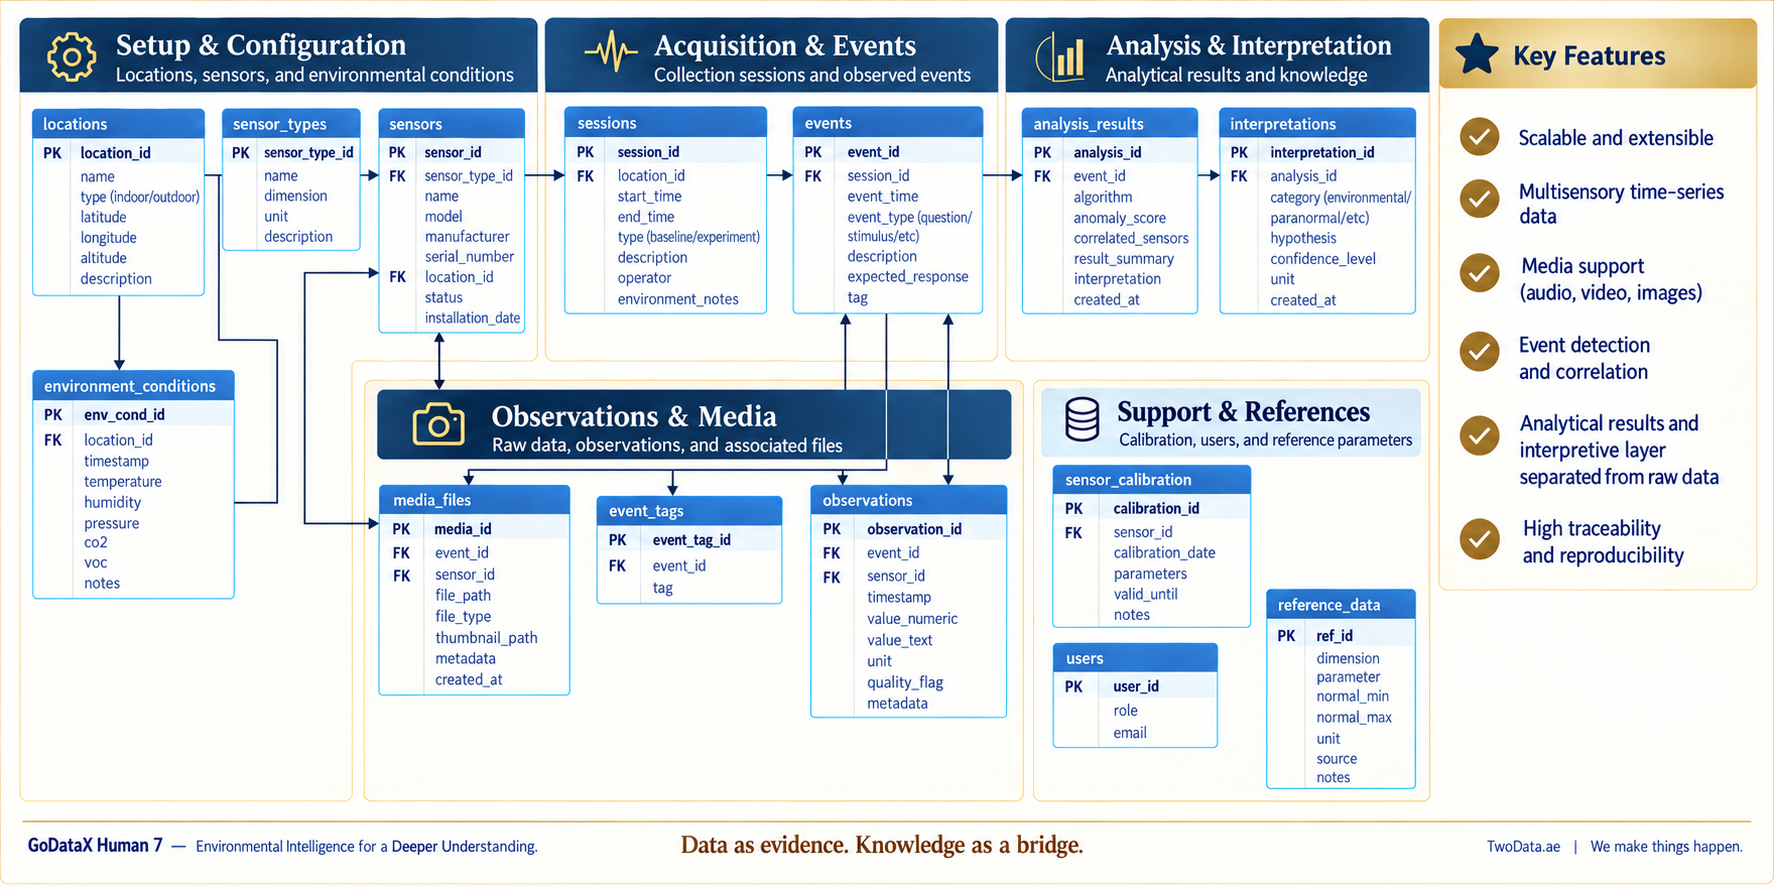
The Relational Database Model
A detailed, traceable relational structure organizes registration and configuration (locations, sensor_types, sensors, environment_conditions), acquisition and events (sessions, events), observations and media (media_files, event_tags, observations), analysis and interpretation (analysis_results, interpretations), and support and reference data (sensor_calibration, users, reference_data).
| Scalable and extensible |
| Multisensor time-series data |
| Media support (audio, video, images) |
| Event detection and correlation |
| Analytical results and interpretive layer kept separate from raw data |
| High traceability and reproducibility |
Sensor Integration Architecture
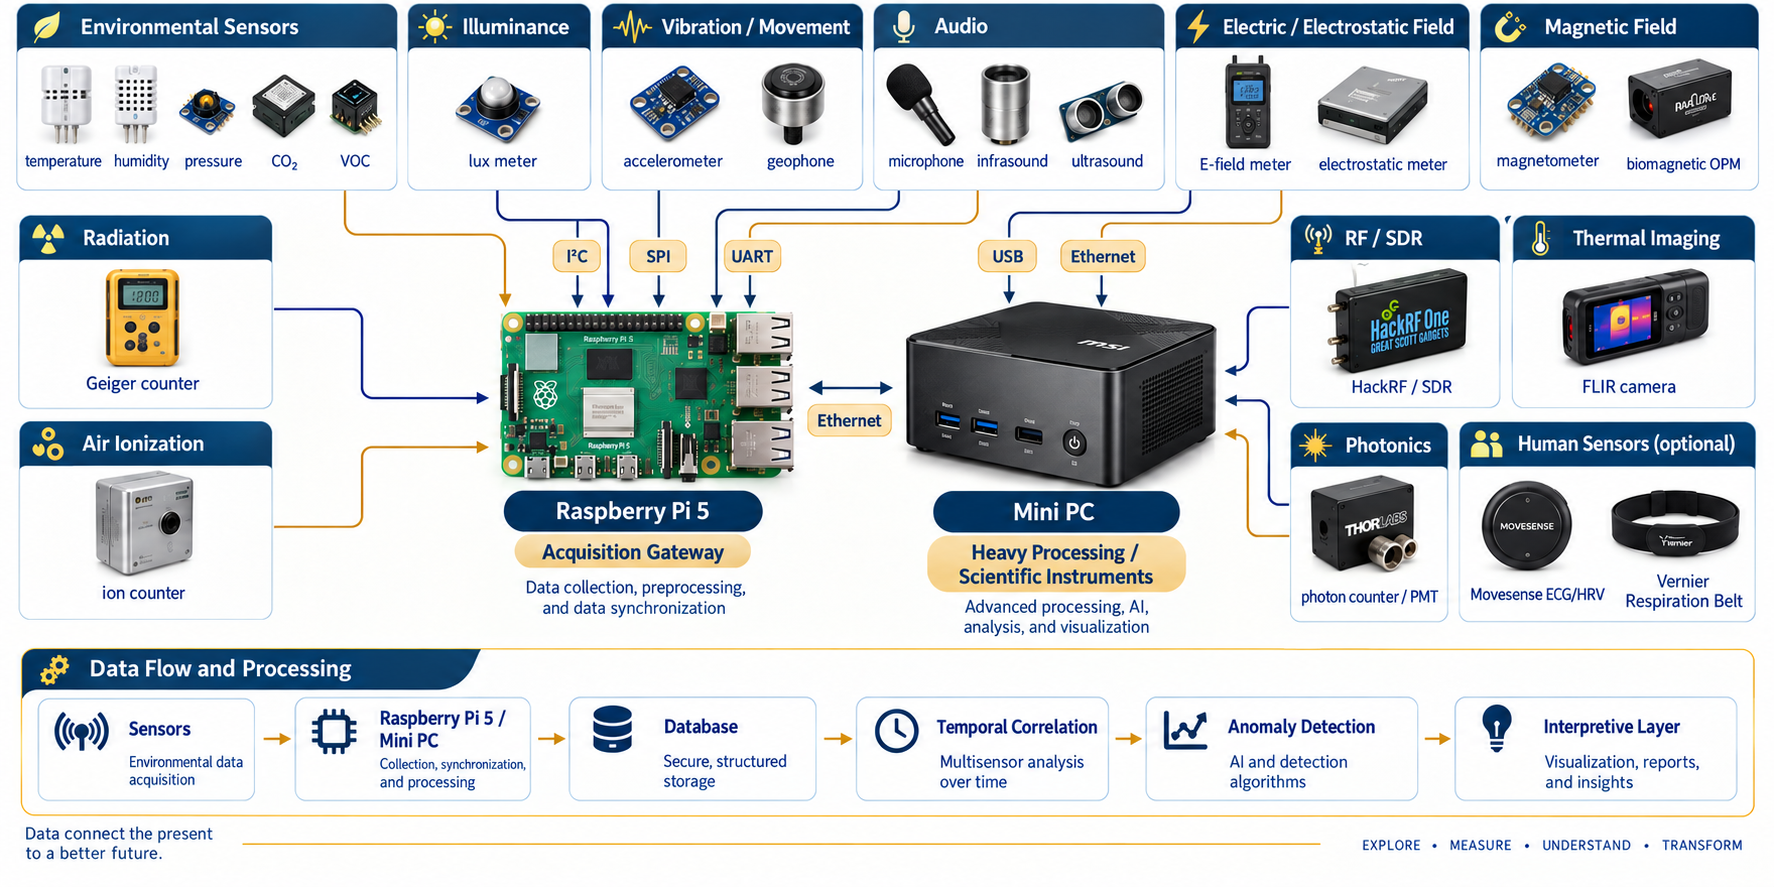
A Raspberry Pi 5 acts as the acquisition gateway (collection, pre-processing, and data synchronization via I²C, SPI, and UART) for the environmental, luminosity, vibration/motion, audio, electric/electrostatic field, and magnetic field sensors, while radiation and air ionization connect directly to it. A Mini PC receives, via USB and Ethernet, the heavy processing load from the scientific instruments (RF/SDR, thermal imaging, photonics, and optional human sensors such as an ECG/HRV sensor and the Vernier respiration belt), handling advanced processing, AI, analysis, and visualization.
Sensors → Raspberry Pi 5 / Mini PC → Database → Temporal Correlation → Anomaly Detection → Interpretive Layer
Data connects the present to a better future. Explore · Measure · Understand · Transform.
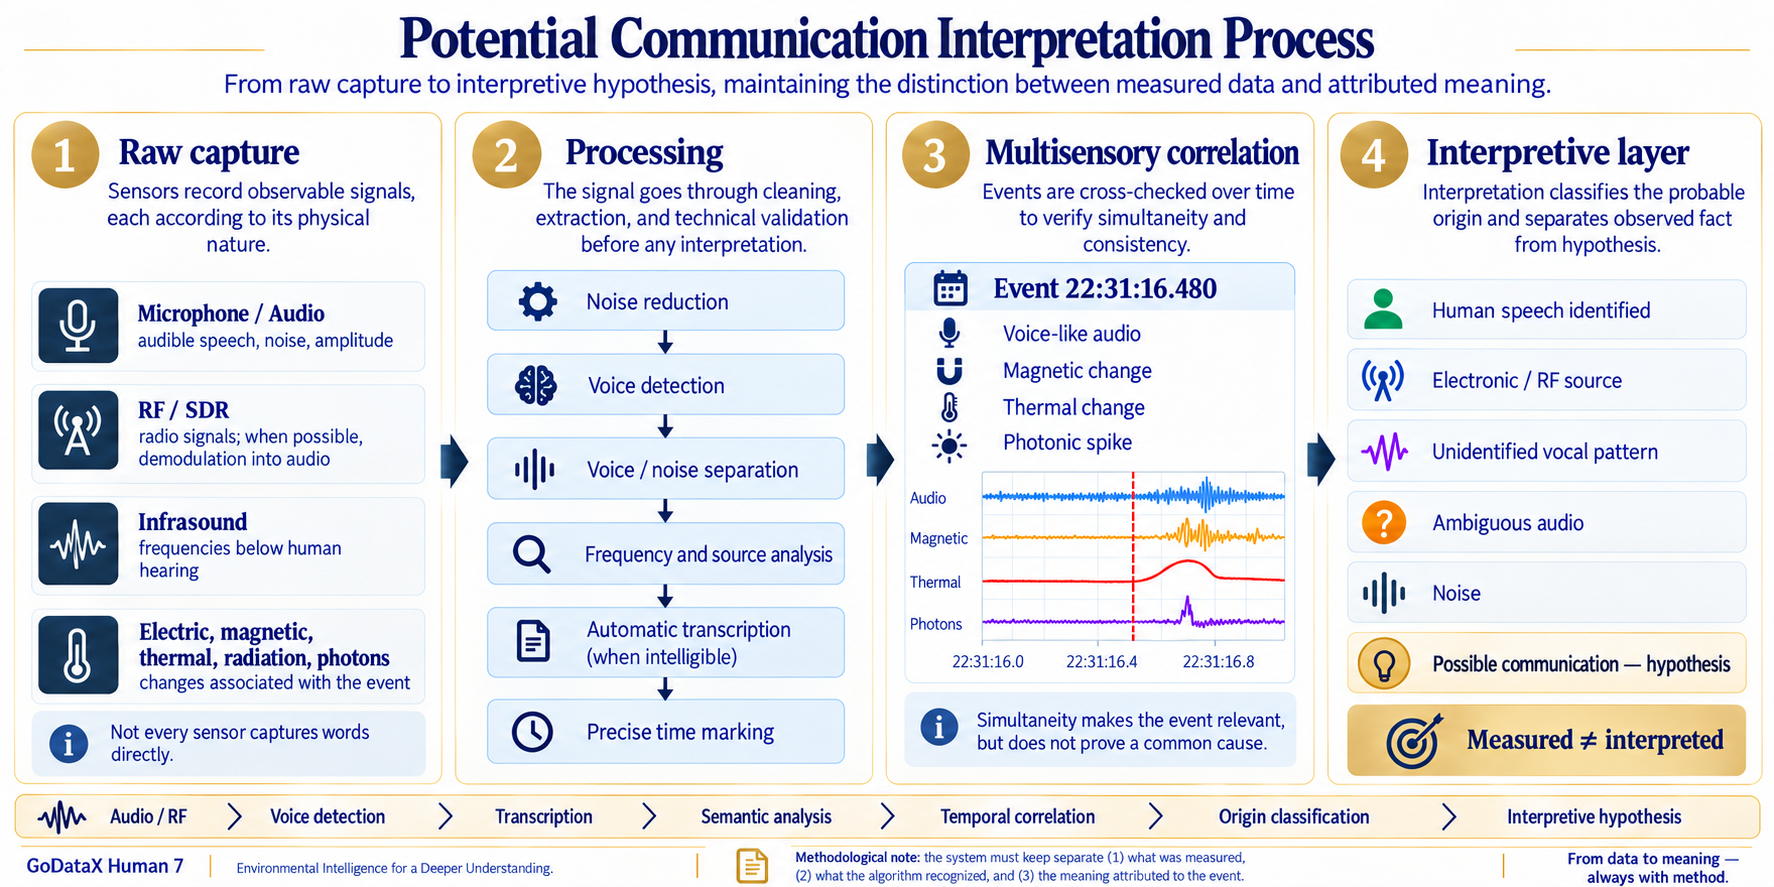
The Data Treatment Layer: From Raw Capture to Interpretive Hypothesis
Every multisensor event recorded by the EAP architecture passes through the same four-stage treatment pipeline before it can be read as anything more than a set of numbers. Raw capture is sensor-specific: a microphone records amplitude over time, an SDR receiver records a radio spectrum that may or may not be demodulated into audio, and the thermal, magnetic, radiation, and photon-count channels each record a physical quantity in its own unit, none of them capturing “words” or “presence” directly. Processing is where each raw stream is cleaned and made analyzable without yet being interpreted: noise reduction, voice detection, voice/noise separation, frequency and source analysis, automatic transcription when the signal is intelligible, and precise time-stamping so every processed sample can be replayed against the others. Multisensory correlation takes the processed streams and checks them against each other in a shared time window, an audio spike, a magnetic-field change, a thermal shift, and a photon-count spike are flagged as one candidate event only if they cluster around the same timestamp, simultaneity is what makes an event worth reviewing, not proof that the channels share a common cause. Only then does the interpretive layer act, classifying the probable origin of a correlated event, human speech, an electronic/RF source, an unidentified vocal pattern, ambient noise, or an open hypothesis such as “possible communication”, while keeping that classification explicitly labeled as an inference, never as a second measurement.
This is an excerpt covering the environmental and anomalous phenomena bias of the instrument. Read the full article, GoDataX Human 7: A Multidimensional Measuring Instrument for Human Evolution, for the psychological, physiological, metaphysical, philosophical, energetic and remaining sections.