

Statistical mathematics in R for Market basket analysis and price elasticity
Scientific article presented as a partial requirement for obtaining the certificate of the Lato Sensu Postgraduate Degree in Data Science and Big Data at the Pontifical Catholic University of Minas Gerais, Brazil.
1.0 Introduction
The analysis aims to understand the behavior of the coupon issuance and sales process of a national wholesale corporation in fuel ethanol, biodiesel, gasoline, and other petroleum derivatives. The goal is to generate insights that can help managers assimilate these scenarios to adjust the company's strategy, seeking better returns on investments.
To achieve this, the analysis is structured into five development stages: data collection, data processing and cleaning, data analysis and exploration, model creation, and presentation of results.
1.1 Contextualization
The introduction presents the macro scope of the analysis and the necessary phases for model development. Next, information on data collection and subsequent transformation stages will be detailed, which include selecting the most relevant input variables for the proposed models: descriptive product analysis, basket analysis, price elasticity, and price optimization.
This process consists of analyzing and exploring data to understand the key numbers and consolidate descriptive research. Additionally, data mining techniques will be used to refine market basket analysis, generating insights into purchasing habits and product associations. These results will help boost the sales of fuels and lubricants from the distributor by identifying optimal product combinations.
Since the study focuses on sales and pricing analysis, an elasticity model is also applied, highlighting the relationship between price variations and sales fluctuations. This allows for identifying potential price adjustments to improve business results.
Finally, the results obtained from the analysis will be presented.
1.2 Proposed Problem
It is evident that combined sales of fuels and, at times, lubricants increase when promotions are offered to large suppliers and customers. However, these promotions are often defined arbitrarily, without a scientific basis, relying on the experience and intuition of decision-makers. As a result, many campaigns lead to decreased sales or fail to achieve their intended outcomes.
Moreover, sales are influenced by various macroeconomic factors, such as economic conditions, price indices, political events, and crises, which are often difficult to measure or predict. This uncertainty makes tacit knowledge-based decision-making increasingly unreliable.
Given this scenario, the present analysis aims to leverage recent data relevant to the current macroeconomic environment, implement market basket analysis models, calculate sales elasticity, and evaluate the relationship between price variations and sales volume. The goal is to increase the probability of accurate decision-making based on historical data, ultimately boosting sales and maximizing return on investment (ROI).
Product Combination in Sales
Promotions offered to major suppliers and customers; Random definition, without scientific basis, A/B testing, based on tacit experience acquired over time; Sales declines, macroeconomic factors, economy, price index, political events, etc.; Example of crises, COVID, etc.
Recent Data
Relevant to the macroeconomic context; Basket analysis known as Market Basket Analysis; Sales elasticity; Sales volume variation with price fluctuation.
Operationalizing the Model
Achieve a higher probability of accuracy; Use current and real historical data, a living model; Increase sales, higher ROI, etc.
2.0 Data Collection
The sample used in this study was provided by the client at the moment the need was identified. The data was understood as real orders issued at sales stations and distribution centers between July 30, 2018, and August 29, 2018.
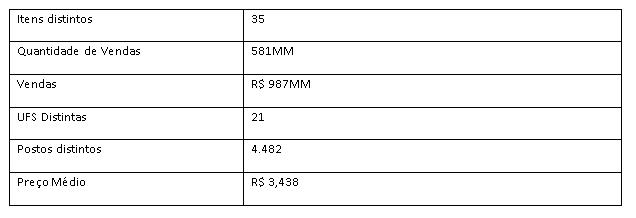
This sample includes 35 distinct products, 581 million items, R$ 987 million in products sold across 21 states through 4,482 gas stations, with an average total product price of R$ 3.438.
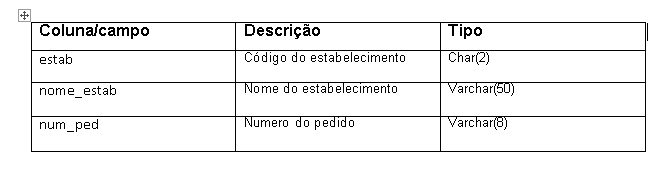
The sample was provided as a file, specifically a text file in the .txt format, containing 79 columns. Below is an example layout of three fields:
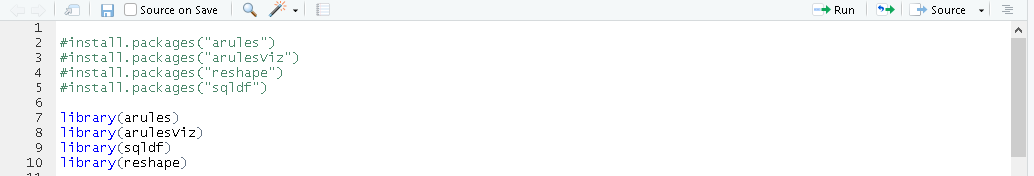
3.1 Tool
The RStudio tool was chosen, a free integrated development environment (IDE) for R, a programming language for graphics and statistical calculations. It demonstrates excellent performance in both data processing and transformation phases as well as in statistical model analysis.
For visualization of some figures and graphs, Tableau was used. It is provided by Tableau Software, an American company and a leader in developing software for data visualization.
3.2 Data Processing and Treatment
The analysis was divided into three processes: product data processing, basket analysis, and price optimization.
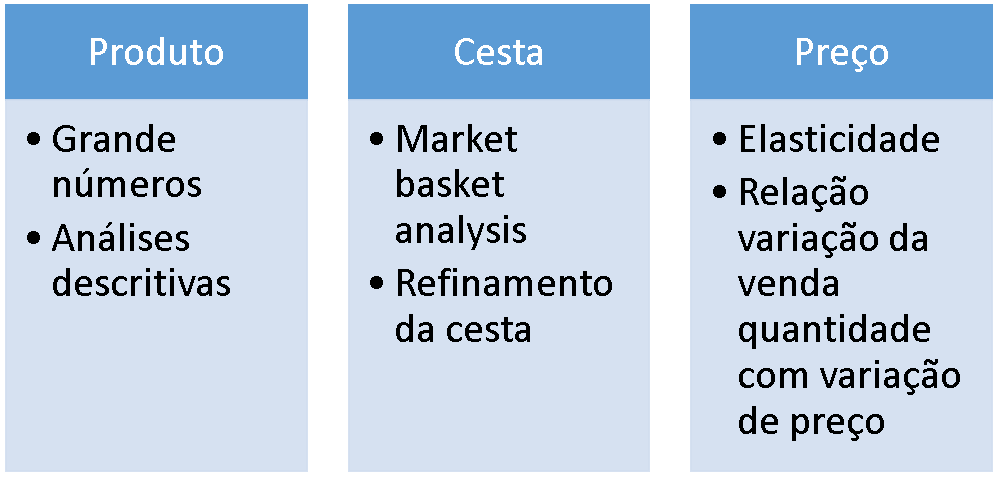
Product
- Large-scale numbers and descriptive analyses;
- We highlighted the key figures found in the sample by selecting the seven most and least sold products, providing consolidated information on issued orders, sales quantity, total value, different states (UF), distinct stations per product, average unit price, and the correlation found between the variables of quantity and price.
Market Basket Analysis - Basket
- Market basket analysis;
- Basket refinement;
- To improve sales, we conducted a small data mining analysis using Basket Analysis, identifying association rules and purchasing habits, mainly verifying product combinations.
Price
- Elasticity;
- We analyzed sales elasticity, highlighting the variation in sales quantity with price fluctuation;
- We identified possible price adjustments to improve sales.
3.2.1 Product Analysis
The processing of product data consists of descriptive analysis, highlighting the key figures found in the sample. This approach will be further detailed in section 4.
3.2.2 Product Basket Analysis
Regarding basket processing, a market basket analysis was conducted, along with refinement and a small data mining analysis. This process identified association rules and purchasing habits, primarily verifying product combinations.
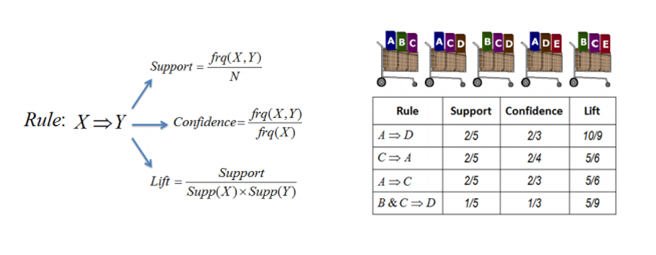
The variables Support, Confidence, and Lift were calculated. Support denotes the frequency of the rule in transactions. A high value means that the rule applies to a significant portion of the database. Confidence indicates the percentage of transactions containing A that also contain B, serving as an estimate of conditional probability. Lift measures the performance of a segmentation model (association rule) in predicting or classifying cases with an enhanced response (compared to the overall population), evaluated against a randomly chosen segmentation model.
This approach will be further detailed in sections 5.1 and 6.1.
3.2.3 Price Analysis
This approach encompasses the understanding of price elasticity and the calculation of price optimization. This will be further detailed in sections 5.2, 5.3, and 6.2.
4.0 Data Analysis and Exploration Details
Initially, the total value aggregation from the provided database was extracted. Then, the seven most and least sold products were selected, presenting consolidated information on issued orders, sales quantity, total value, different states (UF), distinct distribution stations per product, unit price, and the correlation between quantity and price variables.
4.1 Big numbers
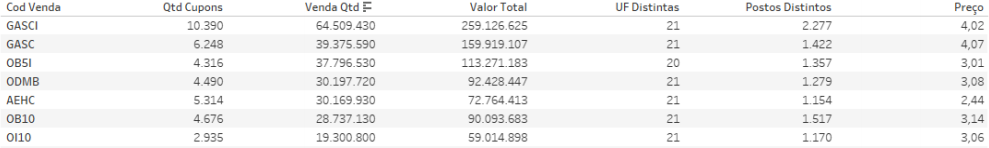
4.2 Best-selling products
Below is a list of the seven best-selling products:
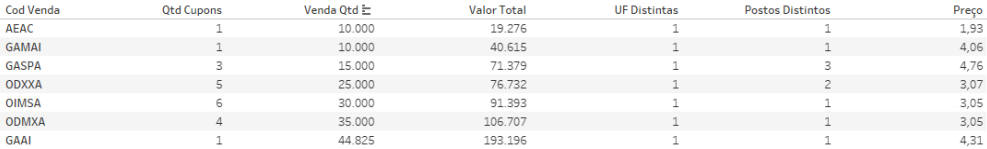
4.3 Least-selling products
Below is the list of the seven least-selling products:
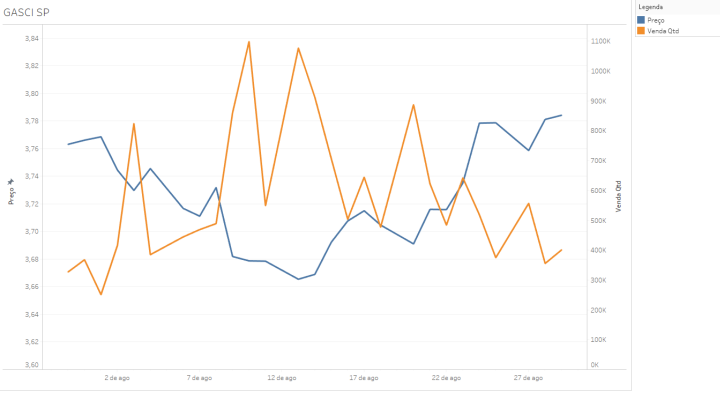
4.4 Analysis of the Best-Selling Product: GASCI
Through the analysis below, a strong relationship between variables is observed. Price decreases lead to an increase in sales quantity. The opposite effect is also noted.
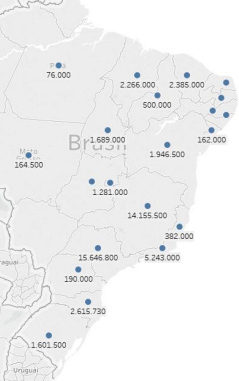
The map below shows that São Paulo (SP) and Minas Gerais (MG) have the highest sales quantities.
5.0 Model Creation
Below is the Data Science Workflow Canvas, which consolidates all phases of the planned model workflow: Problem Statement → Data Acquisition → Data Prep → Modeling → Outcomes Preds → Model Eval.
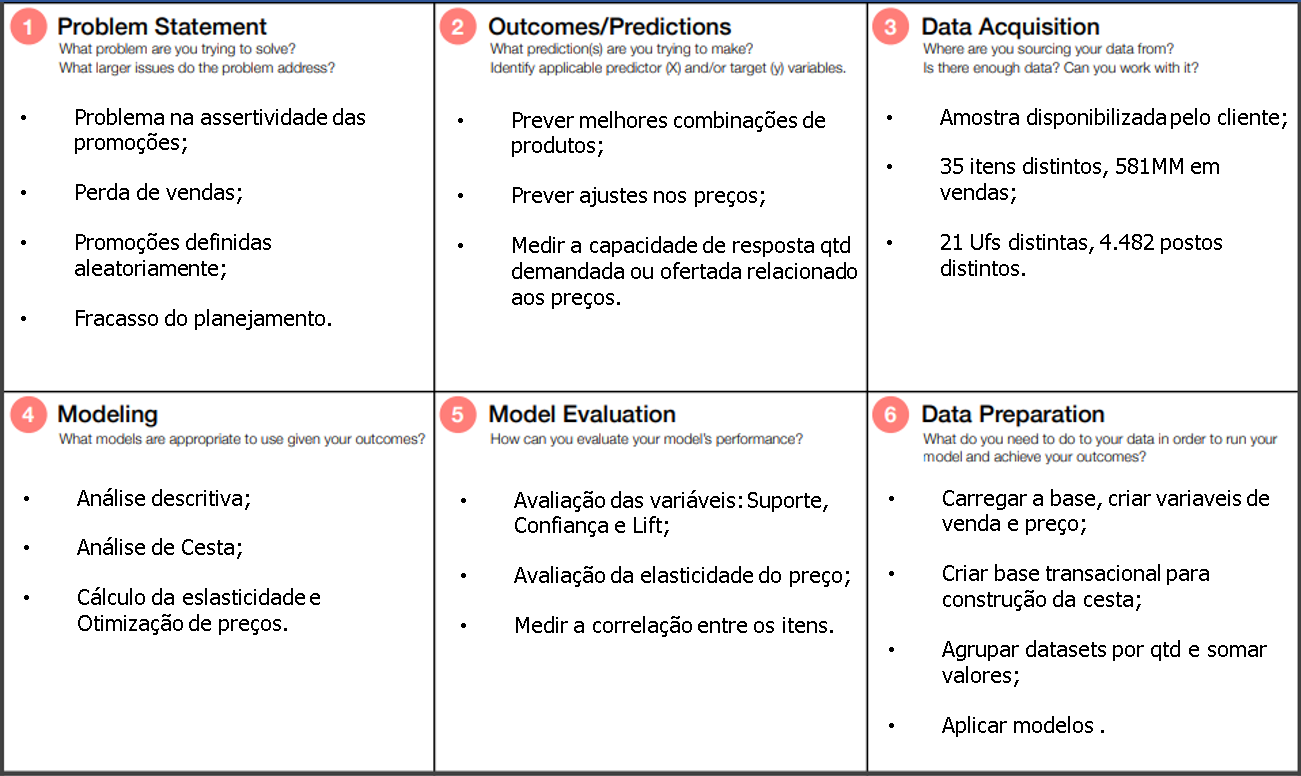
1. Problem Statement
What problem are you trying to solve? What larger issues do the problem address?
- Issue with the accuracy of promotions;
- Sales loss;
- Promotions defined randomly;
- Planning failure.
2. Outcomes/Predictions
What prediction(s) are you trying to make? Identify applicable predictor (X) and/or target (Y) variables.
- Predict better product combinations;
- Predict price adjustments;
- Measure the response capacity in terms of demanded or supplied quantity in relation to prices.
3. Data Acquisition
Where are you sourcing your data from? Is there enough data? Can you work with it?
- Sample provided by the client;
- 35 distinct items, 581MM in sales;
- 21 different states, 4,482 distinct stations.
4. Modeling
What models are appropriate to use given your outcomes?
- Descriptive analysis;
- Basket Analysis;
- Calculation of elasticity and price optimization.
5. Model Evaluation
How can you evaluate your model’s performance?
- Evaluation of variables: Support, Confidence, and Lift;
- Evaluation of price elasticity;
- Measuring the correlation between items.
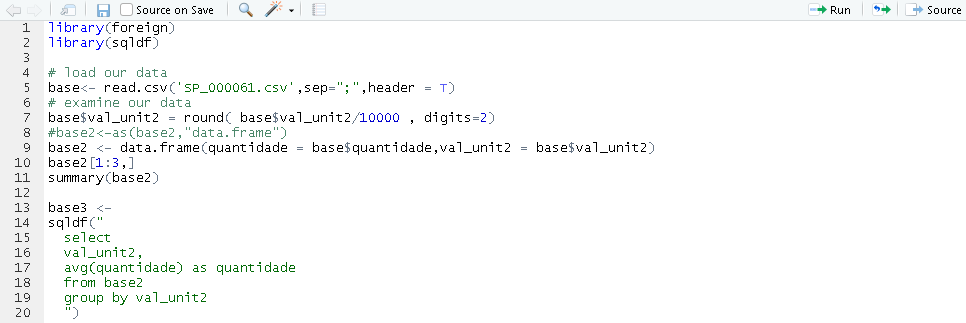
6. Data Preparation
What do you need to do to your data in order to run your model and achieve your outcomes?
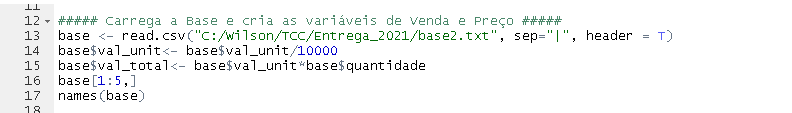
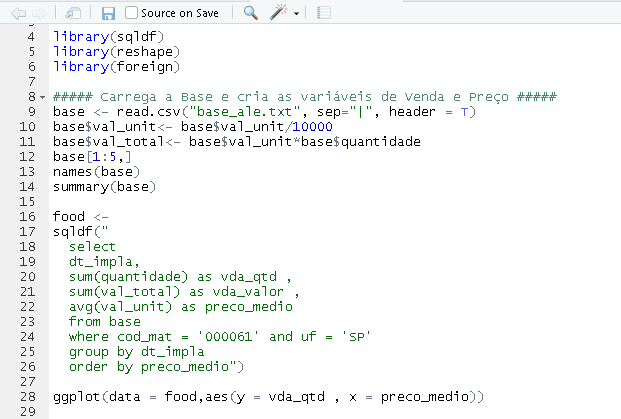
- Load the dataset and create sales and price variables;
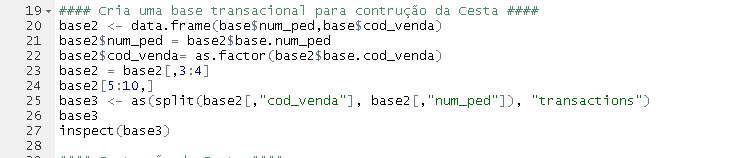
- Create a transactional base for basket construction;
- Group datasets by quantity and sum values;
- Apply models.
The following section details the calculations used, including code evidence, as well as the relationship of the implemented features for the analyses.
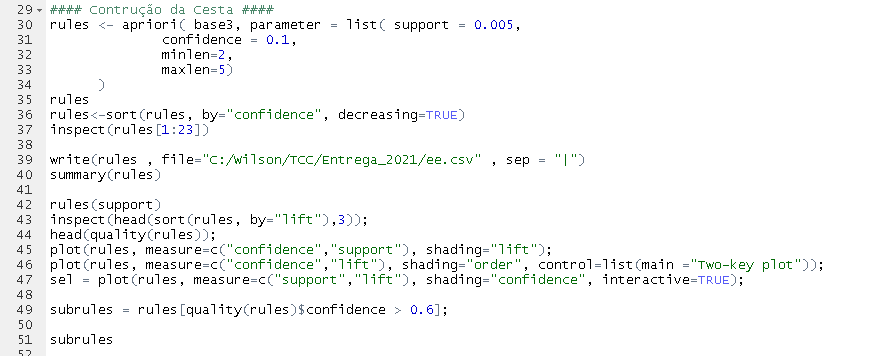
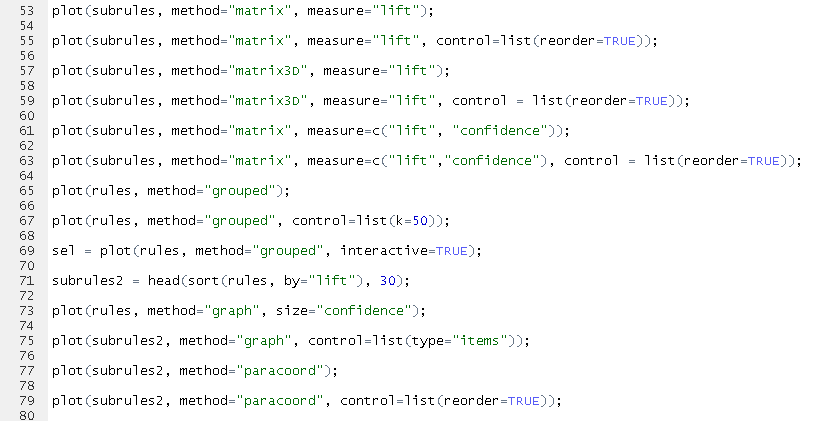
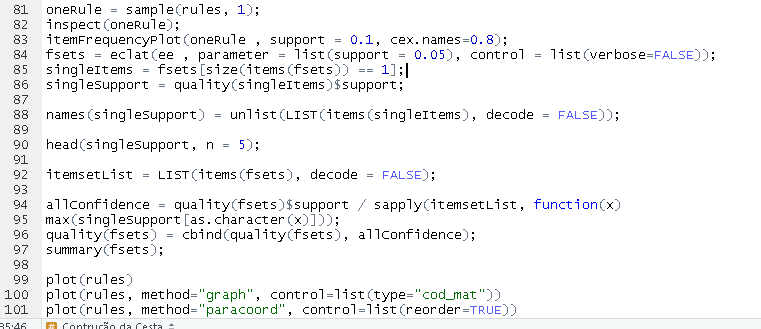
5.1 Basket Analysis Details
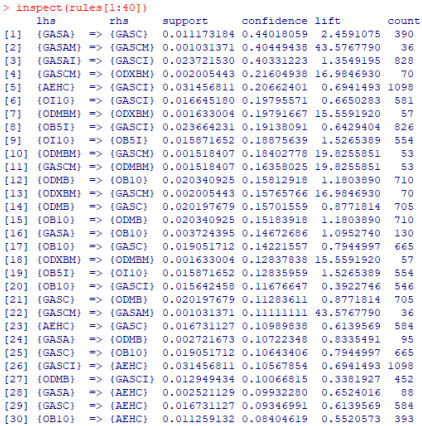
The extraction of association rules [1,2,3] is one of the most well-known problems in Big Data analysis. In this problem, algorithms are used to automatically identify relationships between items in a database.
The analysis below presents arules implemented on the sample dataset described above. This is an association rules package in the R environment, used to identify the most frequent combinations in gasoline and lubricant sales.
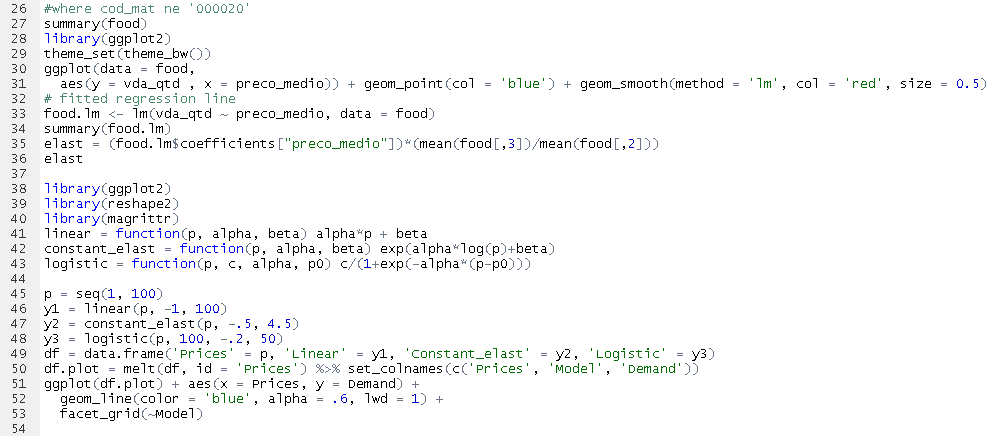
5.2 Price Elasticity Calculation Details
Price elasticity measures the responsiveness of the quantity demanded or supplied of a good to a change in its price. It is calculated as the percentage change in the quantity demanded or supplied divided by the percentage change in price.
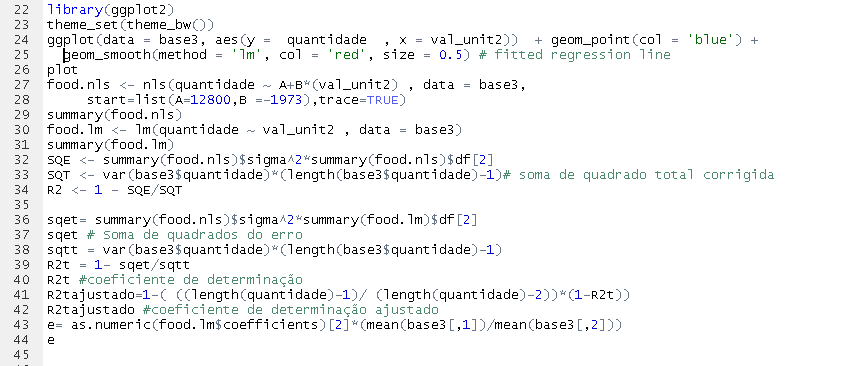
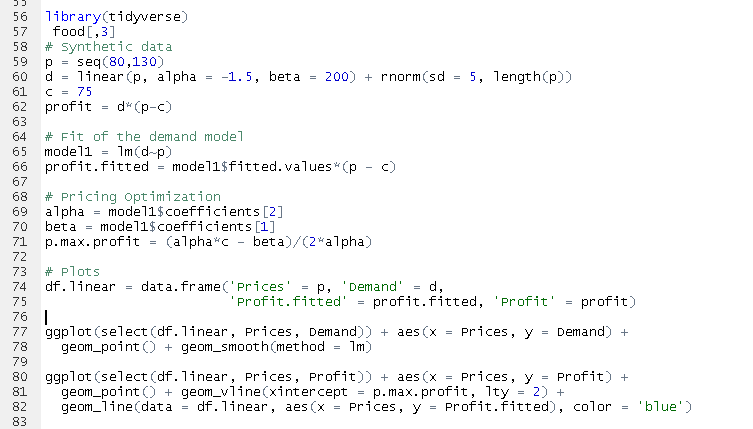
5.3 Price Optimization Details
Below, the price optimization calculation is implemented. The main idea behind this problem is to define the best price to charge in order to maximize revenues and, consequently, profits.
6.0 Presentation of Results
6.1 Identified Numbers and Baskets
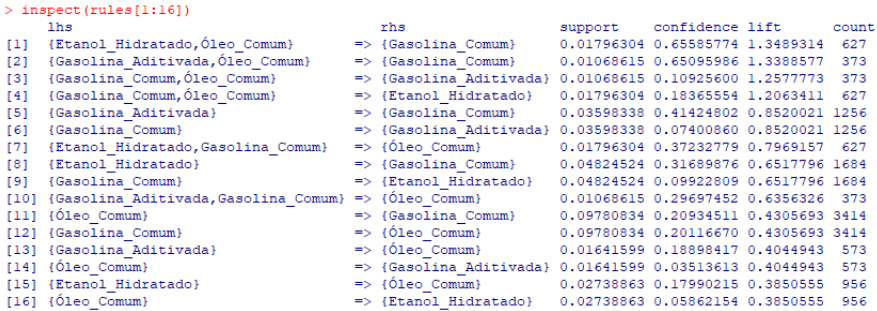
a. The top three baskets are the first ones, as they have Confidence greater than 40% and Lift greater than 1 (which indicates dependency between the items).
b. However, these baskets relate to "Similar" products. Those who buy premium gasoline also buy regular gasoline of the same type.
Period: 07/30/2018 to 08/29/2018
In addition to having high frequency, the first two baskets show high confidence (60%) and a Lift greater than 1, ensuring dependency between the items in the basket.
a. It is concluded that Common Diesel, along with ethanol or premium gasoline, generates a higher number of receipts for regular gasoline.
b. This creates the possibility of better price offers for these four highly dependent item groups.
c. Refining the previous analysis, an item grouping was performed, resulting in seven new groups: Regular Gasoline, Premium Gasoline, Regular Diesel Oil, Premium Diesel Oil, Hydrated Ethanol, Anhydrous Ethanol, and Compressed Natural Gas (CNG).
6.2 Price Analysis Results
Finally, the price analysis includes the calculation of sales elasticity, highlighting the variation in sales quantity with price fluctuations, while also identifying potential price adjustments to improve sales.
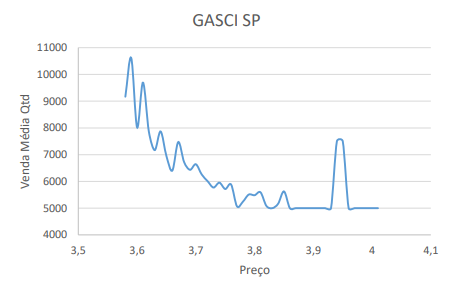
The price elasticity of regular gasoline (GASCI) in the state of São Paulo (SP) is approximately -11 (considered high), meaning that a 1% price variation results in an 11% change in sales quantity.
A correlation of 0.72 was identified; therefore, for ethanol and regular diesel orders, the recommendation is to offer regular gasoline with a small discount.
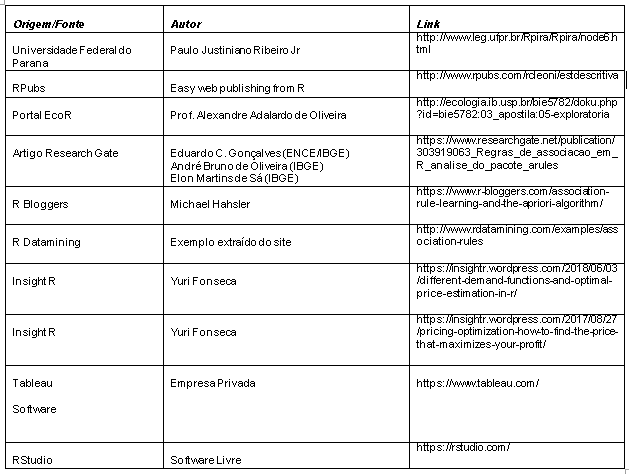
References
Below are references related to the technologies and methodologies used in defining and implementing the analyses.
Glossary
Below are descriptions and terms used in this document.
Support: Denotes the frequency of a rule in transactions. A high value means that the rule applies to a significant portion of the database.
Confidence: Reveals the percentage of transactions containing A that also contain B. It is an estimate of conditional probability.
Lift: A measure of the performance of a segmentation model (association rule) in predicting or classifying cases with improved response (compared to the general population), measured against a randomly chosen segmentation model.
Elasticity: Measures the responsiveness of the quantity demanded or supplied of a good to a change in its price.
Price Optimization: Determines the best price to charge to maximize revenues and, consequently, profits.
ROI: Return on Investment, also known as the rate of return or simply return, is the ratio between the amount of money gained as a result of an investment and the amount of money invested.
Market Basket Analysis: A technique that identifies the strength of the association between pairs of products purchased together and detects co-occurrence patterns. A co-occurrence happens when two or more things occur together.
Inputs: In computer science, input generally refers to providing or supplying something to a computer/process.
Data Science Workflow Canvas: A framework that helps data scientists identify the necessary steps for creating statistical models and delivering results.